

Executive Summary
For 15 years, US equity markets experienced unprecedented large cap tech consolidation, leading many institutional asset allocators to abandon dedicated small cap strategies.
Today, that structural cycle has broken. Current asset allocation models—which frequently utilize a combined Large/SMID strategy instead of pure small cap exposure—suffer from an uncompensated concentration risk. This structural blind spot emerges precisely as a multi-year small cap leadership cycle begins.
The Extremes of Large Cap Leadership
The previous 15-year equity cycle marked the longest period of large cap leadership cycle record. Driven by the mega cap “Mag 7,” market concentration reached historic extremes.
- Index Distortion: The Mag 7 represented 38% of the market cap of the S&P 500 during Q4 2025. Today three companies (Nvidia, Apple, and Alphabet) each have market capitalization exceeding the entire Bloomberg 2000 Index.
- Valuation Premiums: Large cap valuation multiples (Price/Book and EV/EBITDA) increased to a 40% to 50% premium relative to their long-term historical averages according to Bloomberg.
- The Small Cap Discount: Conversely, small cap equities trade at significant discounts to their large cap peers and remain near their long-term historical average multiples.
The large cap recency bias has led many consultants and their clients to eliminate dedicated US Small Cap strategies all together, opting to pair Large Cap and SMID (Small/Mid) strategies to gain domestic market exposure. This choice leaves institutional portfolios underweight small capitalization stocks and makes them vulnerable to a small cap leadership cycle.
The “Magnificent 7” (or Mag 7) is a group of seven mega-cap U.S. technology and growth companies that heavily influence the stock market. The constituents are: Alphabet Inc. (Google), Amazon.com, Inc., Apple Inc., Meta Platforms, Inc. (Facebook/ Instagram), Microsoft Corp., Nvidia Corp. and Tesla, Inc.
The Catalyst: AI Infrastructure as a Corporate Wealth Transfer
The structural regime shifted following the market’s cyclical trough in April 2025. Since those lows, small cap equities have outperformed large caps by approximately 20% on average. The rotation toward small caps is supported by improving economic backdrop and a favorable regulatory environment. Additionally, the artificial intelligence infrastructure spending is an underappreciated catalyst for small cap companies.
Over the last decade, mega cap hyperscalers were incredibly successful free cash flow producers, but over the last 18 months they have been aggressively putting capital into physical AI infrastructure. This spending constitutes a historic transfer of capital from mega cap balance sheets straight into the revenue lines of smaller companies across multiple industries. As a result, revenue and earnings growth rates for small cap corporations are accelerating while valuations for the group remain attractive to large cap and private companies.
The SMID Illusion: Why Broad Allocations Miss the Alpha
Historical data demonstrates that small cap equities have led domestic markets nearly half the time over the last 50 years. However, generating alpha during a small cap cycle requires exposure to small cap companies across the market cap spectrum.
An analysis by Furey Research evaluated the last 40 years of market data, isolating the 11 calendar years where small caps outperformed large caps by more than 4%. The findings uncover a critical nuance for portfolio construction:
% Relative Return in Years when the R2000 Beats the S&P 500 by 4% + R2000 Market Cap Quintile (Russell 2000)
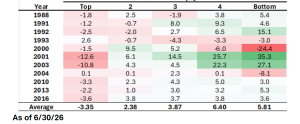
Exhibit 1 clearly shows that within the small cap universe, the largest market-cap quintile underperformed the remaining four quintiles by nearly 8% annually. At the end of Q2, the market cap of the top quintile started at $2.78 billion compared to an average market capitalization of $8.3 billion for the 50 small cap managers with the most assets under management. For comparison, the typical weighted average market cap of SMID managers range between $13 billion and $20 billion.
This data exposes the flaw in the standard Large/SMID allocation model as small caps outperformed large caps by an average of 10% and mid-caps by 3.5% during these same 11 years.
Portfolio Optimization via Pure-Play Small Cap Strategies
As the market rotates toward sustained small cap leadership, institutional plans must re-evaluate their tracking metrics. For portfolios currently restricted to a Large/SMID framework, introducing a dedicated, pure-play small cap strategy repairs this asset allocation gap.
Penn Capital offers two institutional strategies engineered to capture this specific alpha profile:
1. Penn Capital Small Cap Equity Strategy
- Market Cap Alignment: Maintains an average market capitalization directly in line with the Bloomberg 2000 July 2026 Index.
- Historical Capture: Has delivered a net 8.4% annualized excess returns relative to the most common small cap benchmarks since inception during years of small cap outperformance.
- Portfolio Fit: Pairs efficiently with existing defensive, quality or growth-oriented managers.
2. Penn Capital Smaller Company Equity Strategy
- Small Market Cap Focus: Mandated to invest at least 50% of portfolio assets in companies with market caps in smallest 75% of the Bloomberg 2000 index.
- Capitalization Profile: Features a weighted average market capitalization approximately $1 billion smaller than the core index.
- Historical Capture: Has generated 16% annualized net excess returns during periods of small cap leadership since its inception, emphasizing market quintiles that have historically exhibited favorable performance during similar market environments.
For more information, email: info@penncapital.com
Disclosure
Investing in the stock market involves gains and losses and may not be suitable for all investors. Investing in equity securities is speculative and involves substantial risk. Small and mid- cap securities may involve more risk than larger-cap securities. Investments concentrated in sector or specific industry may involve greater risk and volatility than more diversified investments.
Past performance does not guarantee future results and there is no assurance the strategy will achieve similar performance under future market conditions.