

Executive Summary
The five largest publicly traded hyperscalers — Amazon, Alphabet, Microsoft, Meta, and Oracle — are executing likely the most aggressive coordinated private sector capital expenditure (Capex) cycle in modern history, expected to reach nearly $690 billion this year, roughly 2% of GDP, and $4.7 trillion between 2025-2030. Once the greatest free cash flow (FCF) generators, this group’s FCF is compressing to levels last seen in 2013, resulting in little capacity to return capital to shareholders.
The spending is not disappearing — it is migrating down the market cap spectrum into the power, utilities, energy, materials, communications, technology and industrials sectors that must physically build and fuel the AI economy. For investors positioned in small- and mid-cap companies, this dynamic represents a multi-year structural tailwind. Credit markets have so far been willing to finance much of this buildout, but we believe Oracle’s recent credit debacle is a reminder that debt markets can reprice capital intensity quickly and may provide an early signal for equities.
The Scale of the AI Infrastructure Buildout & Historical Comparisons
The hyperscalers combined capex guidance for 2026 of nearly $690 billion is up 81% and 207% from 2025 and 2024 levels, respectively. Roughly 75% of that is directly being allocated to AI infrastructure such as GPUs, high-bandwidth servers, networking equipment, and purpose-built data centers. While the numbers are already staggering, they are only projected to grow larger with Wall Street analyst’s consensus estimate reaching $930 billion by 2028 and a total of $4.7 trillion from 2025-2030. These estimates do not include OpenAI, a large private hyperscaler, which has committed to spending $600 billion by 2030. There are plenty of smaller companies, such as Anthropic and xAI, which have committed to $10s of billions/year.
For context, there are a few similar periods in recent history worth examining (all CPI inflation adjusted). From a magnitude standpoint, the ~$7 trillion US fiscal stimulus during Covid in 2020-21 is most comparable. Stimulus during the GFC was much smaller at ~$1.3 trillion in 2009. The most recent major capex cycle was the 2010s energy “Shale Revolution” when advancements in fracking and horizontal drilling spurred a spending frenzy. According to an IEEFA report tracking a sample of 30 publicly traded North American Shale oil and gas companies from 2010-2020, the group spent $913 billion of capex and had negative free cash flow of -$226 billion. Free cash flow was negative every year except 2020 when they finally cut capex dramatically. During that period, supply expanded dramatically and in 2014/15 oil collapsed from $110/bbl to $35/bbl. The Russell 2000 Energy Index generated a negative -63% total return that decade. The fallout included 600+ bankruptcy filings according to Haynes and Boone, a TX based global law firm. The 1990s telecom infrastructure build out had similar characteristics – real demand from the internet led to major capital investment in and valuations ran ahead of expectations. A decade later, there was too much supply and intense competition which led to plenty of bankruptcies. Finally, the only major capex cycle that likely dwarfs this current cycle is the railroad boom in the 1880s. While much smaller in dollars, it is estimated to have been 5-6% of US GDP, albeit on a much smaller denominator versus today, versus the AI capex at 2% of GDP.
New technologies often attract large amounts of capital, but the pioneers can overestimate future demand and simultaneously miscalculate the required supply as they do not properly estimate the ongoing productivity gains of the new technology. This investment surge, while potentially strategically rational, could be a harbinger of past cycles if the expected returns are not realized on these investments.
FCF Compression Leaves No Fuel for the Capital Return Engine
For more than a decade, the mega-cap technology companies were known as prolific free cash flow generators and capital return machines. From 2010 to 2024, the group generated $2.7 trillion of operating cash flow (OCF) and spent 39% of that on capex, leaving 61% available for buybacks and dividends. That regime has changed and capex is projected to be in the 90%+ range for the next few years, leaving little excess for returning capital to shareholders without drawing on cash balances or issuing debt. Reduced buyback activity will directly weigh on the broader large cap market indexes, removing a meaningful technical support system for large cap-tech valuations.
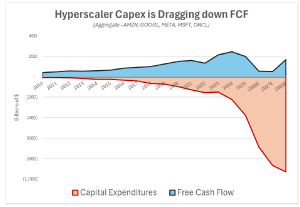
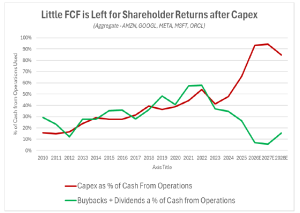
Source: Bloomberg Data as of May 2026
The combined balance sheets of the hyperscalers have doubled their net debt position in 2025 and added $120+ billion of debt since year to date. Additionally, total fixed obligations of the hyperscalers warrant a further look as most have committed to off balance sheet obligations nearing $1 trillion dollars, primarily in the form of lease obligations and commitments for chip purchases. While not traditional debt, these lease obligations are a contractual fixed payment to be accounted for.
This does not mean the hyperscalers are permanently impaired. These investments may prove highly rational if AI monetization scales as expected. But when capex growth becomes structurally disconnected from free cash flow, the right variables to watch are debt issuance, funding gaps, and credit spreads. So far, we’ve seen spreads widen and net debt positions accelerate, albeit at a small number relative to the group’s earnings power, with Oracle serving as a posterchild.
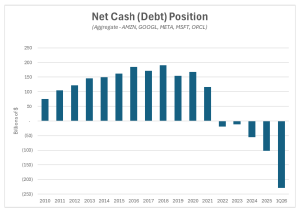
Source: Bloomberg Data as of May 2026
A Credit Market Warning: Oracle Case Study
No company better illustrates the financing risk embedded in this cycle than Oracle. ORCL nearly doubled from the end of 2024 to its peak in September 2025 as investors embraced its role in the AI buildout through Stargate, cloud expansion with Google, and power-related agreements tied to data center growth. On September 10, 2025, Oracle announced a $300 billion compute capacity deal with OpenAI. To support its commitments, the company raised 2026 capex guidance by 43% to $50 billion, creating a funding gap of more than $27 billion per year relative to operating cash flow. Oracle chose to bridge that gap with debt, pushing total obligations materially higher and creating a path where net debt could rise substantially by 2028.
The stock responded positively at first, but credit markets saw the risk earlier. Oracle’s five-year CDS (credit default swap, or insurance against default by a borrower) widened from roughly 40 basis points at the start of 2025 to about 200 basis points by March 2026, implying a 16% default probability, a dramatic repricing for an investment-grade issuer. S&P and Moody’s both moved to a negative outlook.
The equity market followed suit. After peaking in late September 2025 following the OpenAI announcement, ORCL fell -60% into April 2026 as investors reassessed the cash-burning nature of the strategy and the deterioration in credit quality. The sequence matters: equity markets rewarded ambition, credit markets repriced risk, and equities then caught up. In capex-heavy regimes, spreads can become the more reliable early warning indicator.
ORCL 5yr CDS Repricing Risk Ahead of the Stock, Especially in Sept 2025
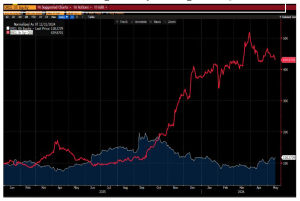
Source: Bloomberg Data as of May 2026
Where the Capital Is Going: The Small- and Mid-Cap Beneficiaries
Hyperscaler dollars do not evaporate, rather they flow through to the physical economy. The demand for power is immense. Morgan Stanley forecasts U.S. data center power demand could reach 74 Gigawatts (1 GW is enough to power ~750-800 thousand homes) by 2028, with a projected shortfall of approximately 49 GW in available power –meaning massive investment in new generation, transmission, and grid infrastructure is not optional. The hyperscalers are becoming asset-heavy, placing copper and steel in the ground, standing up natural gas facilities on site alongside rows of diesel-powered generators, and more to drive their AI buildout. Interestingly, the world seems to have flipped – the asset light technology companies are now dependent on old economy atoms to produce new economy bits and have become massively capital intensive. On the other hand, the energy companies exited their capex cycle described earlier and now are more financially disciplined and capital return oriented.
This supply-demand imbalance in creates durable tailwinds across several sectors where smaller companies dominate and Penn Capital has invested:
• Telecommunications: Companies that facilitate the movement of data via fiber optic cables have become even more valuable as it is estimated that AI now accounts for half of internet data traffic. For example, Lumen Technologies (LUMN) operates one of the most expansive fiber footprints in North America and has secured over $13 billion of orders from hyperscalers. A smaller, regional fiber operator, Uniti Group (UNIT), has secured more than $750 million of contract value related to AI. Ironically, these companies control underutilized assets from the Telecom build of twenty-five years ago that are now being placed in service.
• Technology: Hardware equipment companies that provide tools to increase electrical transmission sign also on the fiber optic cables from electrical to light continue to scale their usage in data centers. For example, Applied Optoelectronics (AAOI) produces optical transceivers and indium phosphide lasers that increase the speed of data movement within chips. Camtek (CAMT) provides tools to memory chip producers, such as Micron and TSMC, for inspecting chips to increase run-time and prolong the life of the semiconductors.
• Energy, Power & Utilities: Data center operators are bypassing constrained power grids via on-site power generation and long-term power purchase agreements with independent power producers (IPPs). Natural gas turbine providers, nuclear operators, and fuel cell manufacturers are securing multi-gigawatt contracts directly with hyperscalers. For example, Solaris Energy Infrastructure (SEI) provides mobile power solutions and is contracted to supply more than 1 GW at two data centers and recently signed a 10-yragreement to provide generation equipment for >500 MW. Talen Energy (TLN) is an IPP that owns a large fleet of nuclear, gas, coal and oil power plants and sells electricity, capacity, and services that has agreed to supply nearly 2 GW of power capacity through an agreement with Amazon. TETRA Technologies (TTI) is seeing robust long-term demand for its zinc-bromide electrolyte used in long-term battery power storage and water desalination in West Texas data centers.
• Industrials & Engineering Services: Companies focused on electrical grid construction, high-voltage transmission, cooling, and data center interconnections are reporting record backlogs. For example, Engineering and Construction firms Dycom (DY), Mastec (MTZ) and Legence (LGN) are directly benefiting from growing data center proliferation at various points of the value chain including construction of the power and communications infrastructure underpinning the data centers. They have seen tremendous growth in their data center/technology businesses and commented on long-term demand tailwinds. On the cooling side, Modine’s (MOD) advanced cooling solutions for data centers grew at 78% last quarter.
• Materials: Copper, steel, and transformer-grade electrical steel are critical inputs for both data center construction and grid expansion. Structural shortages in transformer supply are already delaying projects.
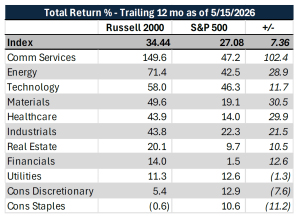
Crucially, much of this spending flows to domestic, smaller-capitalization businesses. What Google spends in a day is a company-defining revenue opportunity for a small cap company. We are seeing these trends in broader market performance. Over the last 12 months, small caps have beaten large caps by 7%+ in aggregate and at a sector level, the noted areas have far outpaced their larger market cap peer groups. The Communications sector in the Russell 2000 Index is beating the S&P 500 Communications by 102%, Energy by 29%, Tech by 12%, Materials by 31%, and Industrials by 21%.
Source: Bloomberg Data as of May 2026
The Small-Cap Investment Thesis and Positioning at Penn Capital
At Penn Capital, we believe this trend has strength and that as mega cap tech spends to win the AI revolution, smaller companies will benefit. Additionally, small cap equities enter this cycle with undemanding relative valuations versus large cap, a tailwind from lower interest rates, and favorable credit markets that facilitate refinancing activity.
In our view, our strategies at Penn Capital are positioned to benefit from this environment. We have been and continue to be overweight in sectors like Energy, Communication Services, Industrial, and Materials, many of our peers are underweight. Many of these companies have complex balance sheets, making our credit expertise especially valuable. We remain vigilant to the risk of the cycle turning as cross-sector correlations rise, and we monitor credit markets closely because they can provide warning signals earlier than equities in downturns driven by leverage, funding stress, or deteriorating liquidity.
Important Disclosure Information
This document has been prepared by Penn Capital Management Company, LLC. (“Penn Capital”) for informational purposes only. This document does not constitute an offer to sell or a solicitation of an offer to buy any security. Past performance is not indicative of future results, and there can be no assurance that the strategy described herein will achieve comparable results or that targeted returns will be realized. All investments involve risk, including the possible loss of principal.
The information contained herein is based on sources believed to be reliable; however, no representation or warranty, express or implied, is made as to its accuracy, completeness, or fairness. This material is intended solely for the use of the person to whom it is delivered and may not be reproduced or redistributed, in whole or in part, without the prior written consent of Penn Capital. Recipients should not construe the contents of this document as legal, tax, regulatory, financial, or accounting advice, and are urged to consult with their own advisors with respect to the legal, tax, regulatory, financial, and accounting implications of any investment.
Any model, graph or chart used has inherent limitations on its use and should not be relied upon for making any investment decisions. Nothing herein should be construed as an offer, or a solicitation of an offer, to invest in or buy an interest in any investment vehicle managed by Penn Capital.
This document does not constitute investment advice and should not be relied upon as the basis for any investment decision. Certain information contained in this document constitutes a “forward-looking statement,” which can be identified by the use of forward-looking terminology, such as “may,” “will,” “seek,” “should,” “expect,” “anticipate,” “estimate,” “intend,” “continue,” “believe,” or the negatives thereof or other variations thereof or comparable terminology. Due to various risks and uncertainties, actual events or results or the actual performance may differ materially from those reflected or contemplated in such forward-looking statements, including a complete loss of investment.